In the first article in this series, we showed how project stakeholder networks can be represented as graphs. In the second article, we explored how manipulation of network topology affects stakeholder centrality and community. In this article, the model is expanded to show how opinions diffuse through a stakeholder network.
Assessing influence in networks
Influence in a network can be modeled as edge weights in a directed graph. The edge weight eij , between nodes i and j, is the probability that stakeholder I is influenced by stakeholder J. The more time that I invests in J, the more I is influenced by J, relative to the time that I invests in all of his or her relationships X.
Influenced_by (I, J) = invests_in (I, J) / ∑ invests_in (I, X)
Network influence can be represented as a sparse weighted adjacency matrix Wij .
To use an example from the case study (see the first article in the series for details), the Executive VP has two incoming network connections, one from the IT Strategist, a personal relationship, and one from the Network VP, a reporting relationship. Since the Executive VP and IT Strategist have worked together for a decade and are co-located, he may spend more time with or be more prone to listen to her than to the Network VP, with whom he has worked only since the merger and at a distance. Arbitrarily, we might estimate that he is 80% likely to be influenced by the IT Strategist and only 20% likely to be influenced by the Network VP.
Influence may be asymmetric, diluted, or unilateral. The IT Strategist has three incoming network connections: Executive VP, a personal relationship, the Network VP, a reporting relationship, and the former Iota IT staff, a personal relationship based on a prior reporting relationship. She might be 40% likely to be influenced by the Executive VP (her former boss and mentor), 30% likely to be influenced by the Network VP (her current boss), and 30% likely to be influenced by the Indianapolis IT staff. The Executive VP is more likely to be influenced by the IT Strategist, than she is by him. The more incoming connections a stakeholder has, the more dispersed and diluted the influence might be. In the case study, the base connection is a communication channel, which implies both parties are involved. Though, it would not be unreasonable to have instances where the communication is strictly in one direction.
In this example, recalcitrance is not considered. That is, a stakeholder does not consider his or her opinion to the exclusion of others’ opinions. The stakeholder does not influence himself or herself. There are no self-loops in the network. However, the model could be expanded to include recalcitrant behavior.
Table 1 shows what the weighted adjacency matrix might be for the third network state, after the PM has encouraged collaboration amongst the three IT groups. The estimates of influence probability are arbitary. In a field setting, the data might be gleaned from communication traffic (e.g., e-mails, document retrieval) or through surveys. See Hangal, et. al. (2005) for further discussion of how weights might be calculated.
Without an underlying metric, the influence weights concocted for the case study are ordinal, at best. We are concerned only about the relative sizes of the estimates. We can say that the Executive VP is more influenced by the IT Strategist than the Network VP. But, we could not state that the influence is four times greater, as the probabilities imply. In constructing the weighted adjacency matrices for the first and second network states, which have fewer nodes and edges, ordinality was maintained for consistency. But, there were variations in weight as node degree changed.
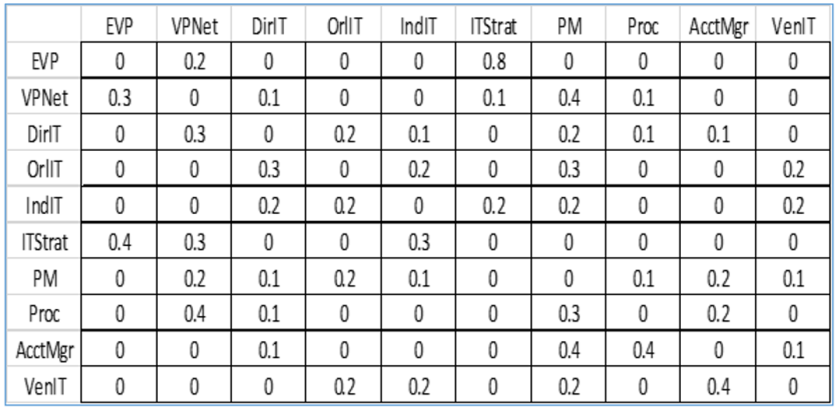
Table 1. Weighted adjacency matrix of influence probabilities, based on the final network state in the case study, after IT collaboration has been established.
Figure 1 shows the graphical representation of the network. In the prior articles, network edges were undirected and unweighted. Here, the edges are directed to show the flow of influence and the thickness of the edge indicates the weight of the influence.
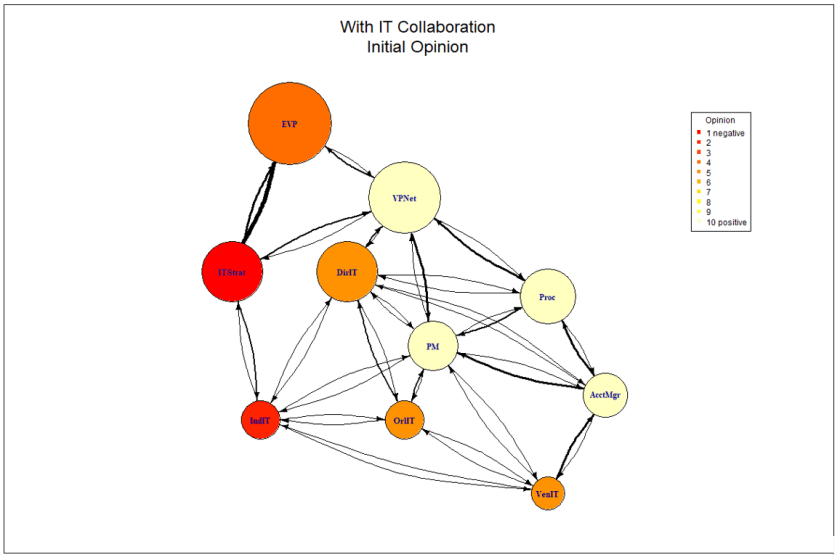
Figure 1. Directed graph representing the network state after IT collaboration, with edge weights representing the likelihood of influence.
Modeling opinion diffusion in an influence network
In the case study, each stakeholder holds an opinion of the project, ranging on a scale from 10 to 1, with 10 representing being totally for the project and 1 representing being totally against. The opinions are stored as a node attribute. See the data table in the first article for a list of node attributes. Opinions can change over time based on the influence of stakeholders directly connected to an individual stakeholder. A stakeholder’s opinion is the weighted average of his or her influencers’ opinions from the prior time period or iteration of the model.
xt = Wtx0
where xt is the vector of stakeholder opinions at time t and W is the weighted adjacency matrix of the graph representing the stakeholder network. All stakeholder nodes are updated concurrently during each iteration of the model. See Montgomery (2011) or DeGroot (1974) for model details.
The mean opinion of all stakeholders converges over time and may reach a steady state or equilibrium. Video 1 shows how stakeholder opinions change over time (25 iterations of the model). The graph used in the video is the initial state of the stakeholder network in the case study, prior to the introduction of the Project Manager.
Video 1. Opinion diffusion in the project stakeholder network prior to the introduction of a Project Manager.
Network topology affects opinion diffusion
Figure 2 shows how the initial set of stakeholder opinions diffuses through the three network states: prior to the Project Manager; after the Project Manager is introduced; and, after the Project Manager and vendor Account Manager encourage collaboration amongst the three IT groups. The model was run for 25 iterations and the mean opinion converged in all three cases.
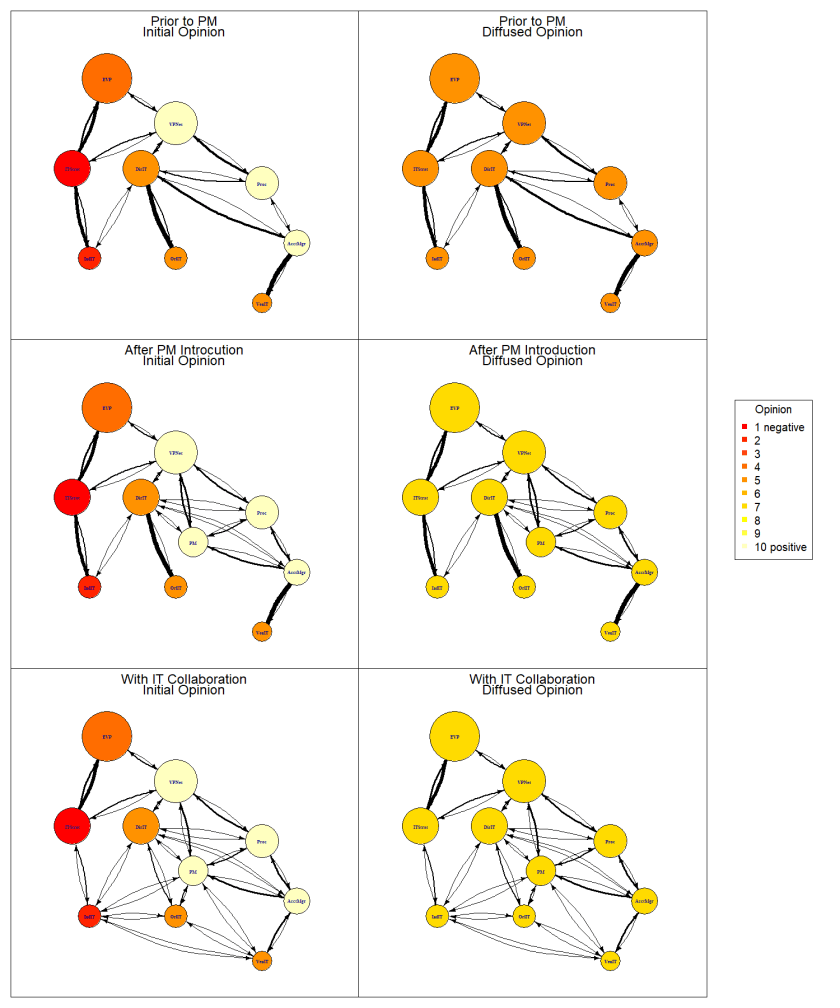
Figure 2. Opinion diffusion over 25 iterations through three network states.
Figure 3 compares the mean opinion over time for the three network states. We see that the introduction of the Project Manager did improve the mean opinion of the project amongst stakeholders. Building a coalition through IT group collaboration did not add much of an increase in mean opinion, but the mean converged more quickly due to the increase in communication channels.
Note that the simulation of each network state started with the same vector of stakeholder opinions. In this article, we are not considering transitions from one state to another. We are simply showing that given a network topology, opinions will diffuse differently depending on that topology.
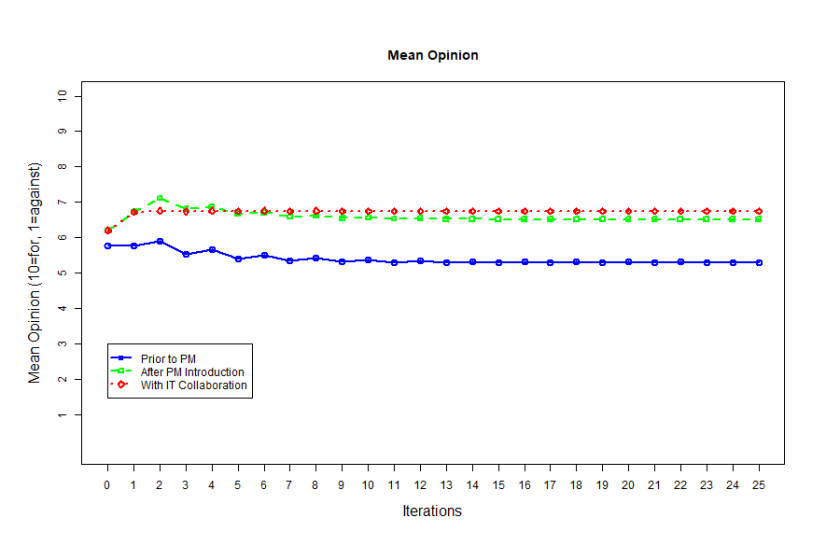
Figure 3. Mean opinion over time for three network states.
Caveats
The model presented in this article shows how stakeholder opinions diffuse and converge over time. However, the data used in the case study is arbitrary and anecdotal. This affects the accuracy and reliability of the model in predicting stakeholder behavior. It raises the issue of how we gather influence and opinion data in the field. Many influence network models are based on an underlying metric, such as messages sent or received, documents retrieved, or number of co-authored articles. Opinion data is obtained through surveys.
Another caveat is the ordinal nature of the influence and opinion scales. While it is easy to say that a stakeholder may be more influenced by one particular stakeholder than another, it is difficult to assess the difference in influence. Likewise, while we may recognize that one stakeholder has a more positive opinion of the project than another, it is difficult to assess the magnitude of that difference. We are dealing with highly subjective data.
And, as noted in the prior articles, the data is sensitive. If the data was collected anonymously, there are restrictions on how it can be shared and presented. If the data is not accurate, its use could cause damage.
Summary
Nonetheless, this example shows how network topology can affect the average opinion of a project within a stakeholder network. We see that adding a stakeholder with a positive opinion of the project shifted the mean opinion of the project. And, increasing communication channels within the network allowed the mean opinion to converge more quickly.
Bibliography
DeGroot, Morris H. (1974). “Reaching Consensus.” Journal of the American Statistical Association, 69(345), 118-121.
Hangal, Sudheendra; Diana MacLean; Monica S. Lam; Jeffrey Heer. (2010). “All Friends are Not Equal: Using Weights in Social Graphs to Improve Search.” The 4th SNA-KDD Workshop 2010. 25 July 2010, Washington, DC. Web. 13 September 2015. (http://mobisocial.stanford.edu/papers/snakdd10.pdf)
Montgomery, James. (2011). “Influence Networks.” Chapter 8 in Mathematical Models of Social Systems (draft). Web. 13 September 2015. (http://www.ssc.wisc.edu/~jmontgom/376textbook.htm)
________________
© Nicklas, Inc. and robinnicklas.com, 2018. All rights reserved. Unauthorized use and/or duplication of this material without express and written permission from this site’s author and/or owner is strictly prohibited.
