In prior articles in this series, we have shown how project stakeholder networks can be modeled as graphs, how network topology affects centrality and community, and how opinions diffuse in such networks. In this article we will look at how project managers can assess the strength of influence paths in a stakeholder network.
Influence paths in social networks
When there is no direct connection between two stakeholders, DeLuca (1998) suggested that a stakeholder needs to “link agendas” with other stakeholders in order to build a “credibility path” to influence the target stakeholder. While having an immediate direct connection is an obvious influence path, DeLuca suggested that there might be more powerful, longer paths. Following these longer paths might be more successful, especially when there is a lack of credibility or trust between a stakeholder and the target stakeholder he or she is trying to influence. Constructing an influence path is the only way to influence another stakeholder when there is no immediate, direct connection.
The opinion diffusion model, discussed in the prior article, considered the influence of a stakeholder’s immediate neighbors on his or her own opinion. The model can be extended to consider the influence of a particular stakeholder on other stakeholders, assuming there is a path between them in the network. A path is the sequence of edges in the network that a stakeholder would need to traverse in order to reach another stakeholder. Each stakeholder along the path influences the next stakeholder in the path towards the target stakeholder. There could be more than one path between two stakeholders. If there is no path between two stakeholders, the stakeholder who is initiating the influence may need to establish necessary connections.
Computing influence path strength
The edge weights in the stakeholder network’s adjacency matrix represent the degree of influence that stakeholder J has over I. Specifically, the weight is the probability that I is influenced by J. The adjacency matrix can be found in the prior article.
The strength of an influence path is its final probability, which equals the product of its edge weights.
∏(eji)
The greater the product, the stronger the influence. By transforming the product into the summation
∑ log(1/ eji)
a shortest path algorithm can be used to find the strongest influence path(s) between any two nodes in the network. See Hangal, et. al. (2010) for details.
An example
The strongest influence path between two stakeholders may not be the most direct (shortest) path, in terms of nodes traversed along the path. We see this in Figure 1, which shows the strongest influence paths between the Project Manager and the IT Strategist. There is no direct communication between them. If the PM wishes to influence the IT Strategist, opening a direct communication may not be the best idea, due to the IT Strategist’s antagonism towards the project and the organizational power imbalance.
The PM’s best option to influence the IT Strategist is to approach the Network VP, who in turn will exert influence on the IT Strategist on behalf of the project. Whereas, if the IT Strategist wants to exert influence on the PM, her best option is to approach the Executive VP, who in turn would exert influence on the Network VP, who in turn would exert influence on the Project Manager. Given the weights defined in the case study (see the weighted adjacency matrix in the prior article), the PM’s influence path towards the IT Strategist is stronger than the IT Strategist’s path towards the PM.
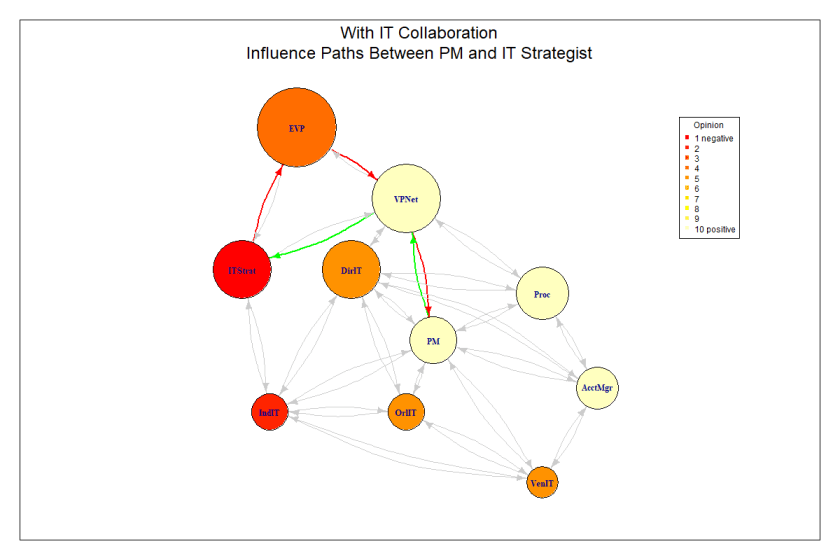
Figure 1. Strongest influence paths between the Project Manager and the IT Strategist
The graphs in Figure 1 and Figure 2 were produced using the R programming language and the igraph package, as described in Ognyanova (2016). Specifically, the shortest_paths and distances functions were used.
Influence across the network
The heat map in Figure 2 shows the strength of the strongest influence path between nodes in the stakeholder network. A darker color represents a stronger path (shortest distance in terms of sum of edge weights and not in terms of number of nodes traversed). The diagonal is empty since we did not consider recalcitrance in the case study.
Reading across the Executive VP row, we see that the IT Strategist has more influence on the EVP than the Network VP has. This is consistent with the strength of their direct relationships. Since we are looking at the network state in which channels of communication have been opened up in order to facilitate collaboration, many of the strongest paths shown in Figure 2 are direct relationships. Extending these paths to include other nodes would only weaken the amount of influence that could be exerted. The IT Strategist to PM path is an exception, where adding the Executive VP into the path strengthened the amount of influence that could be exerted.
The influence paths between the PM and IT Strategist are relatively weak compared to other paths in the stakeholder network. It is not likely that either stakeholder would exercise these paths. This assumes a stakeholder would not attempt to influence another stakeholder unless there was a good chance the attempt would succeed.

Figure 2. Heat map showing strength of influence paths towards individual stakeholders. A more intense color indicates a stronger influence path. The cells in each stakeholder row represent the strength of the strongest influence path coming from the stakeholder in each column.
Summary
In this series of articles, we have explored the application of social network analysis techniques to the study of project stakeholder networks. In the first article, we discussed representing project stakeholder networks as graphs. In the second article, we saw how network topology affects centrality and community in these networks. In the third article, we developed a basic model of opinion diffusion through a network. In this article, we discussed the strength of influence paths within the stakeholder network.
References
DeLuca, Joel M. Political Savvy. (1992). Horsham, PA: LRP Publications. Pp. 104-109.
Hangal, Sudheendra; Diana MacLean; Monica S. Lam; Jeffrey Heer. “All Friends are Not Equal: Using Weights in Social Graphs to Improve Search.” The 4th SNA-KDD Workshop 2010. 25 July 2010, Washington, DC. Retrieved 18 Jine 2018. (http://mobisocial.stanford.edu/papers/snakdd10.pdf)
Ognyanova, K. (2016). Network Analysis and Visualization with R and igraph: NetSci X Tutorial. (http://www.kateto.net/networks-r-igraph; retrieved 6 June 2018)
________________
© Nicklas, Inc. and robinnicklas.com, 2018. All rights reserved. Unauthorized use and/or duplication of this material without express and written permission from this site’s author and/or owner is strictly prohibited.
