Schedule simulation enables project managers to forecast project duration and cost, taking into account the variances that occur during project execution. Tasks run longer or shorter than planned. Costs are higher or lower than expected. However, schedule simulations often do not consider the effect of resource constraints on the schedule being simulated. In a prior article, simulation was used to generate resource-feasible schedules in order to explore and describe the underlying distribution of such schedules. In this article, the process is extended to simulate resource-constrained project schedule duration.
Project schedule simulation
A task duration variance is the difference between the original task duration estimate and the actual task duration after execution. Task durations can be randomly perturbed to mimic the task duration variances that occur during project execution. If we calculate project duration using randomly perturbed task durations, and we do so repeatedly, we can generate a distribution of project durations, described by a mean and standard deviation. Once we know the mean and standard deviation of such a distribution, we can set confidence levels on our project duration estimates.
In project schedule simulation, task durations are treated as random variables. This is accomplished by sampling from a distribution that describes the variation that can occur. If we have diligently recorded our duration estimate errors in the past, we would have an empirical distribution to sample from. However, most of us have not been that diligent. Instead, we assume that the variation in task duration fits some theoretical distribution, such as the uniform, triangular or negative exponential. For the purpose of demonstration, we will use the beta-PERT distribution, which is based on a three-point estimate of optimistic, most-likely and pessimistic durations for a task. In the following example, these three task duration estimates were set arbitrarily to 80%, 100% and 150% of the original task duration estimate. See “The beta-PERT distribution.”
In the prior article mentioned above, an algorithm for generating a resource-feasible, non-delay project schedule was outlined. In that modeling, task durations were integer values and were held constant. In the algorithm, if the static task durations are replaced with task durations randomly sampled from the beta-PERT distribution, a resource-feasible, non-delay schedule is generated, with a schedule duration that will vary randomly each time the algorithm is invoked.
When resource constraints are incorporated into a schedule simulation, the result is a different distribution of project durations from the distribution obtained when only task duration and logical constraints are considered. To show this difference, the simulation is run in two modes: resource unconstrained and resource constrained. The unconstrained mode will show the variation in project duration for an unleveled schedule. The constrained mode will show the variation over a range of resource feasible schedules.
An example
We will continue to use the resource-constrained schedule from Deblaere, et. al. (2007) that we used in the prior article. The unleveled schedule is presented in Figure 1. The critical path is <1,5,8> and the schedule is 13 days long. The set of logical constraints is A = {<0,4>,<1,5>,<2,6>,<3,7>,<5,8>}. There is only one resource type r, and r’s capacity is 10.

Figure 1. Unleveled schedule, adapted from Deblaere, et. al. (2007)
First, the unleveled schedule is simulated without considering resource constraints. Then, the schedule is simulated with resource constraints enforced. The unconstrained schedule simulation is driven by task durations and logical constraints. The constrained schedule simulation is driven by resource constraints, in addition to task durations and logical constraints. As was shown in the prior article, there is a range of resource-feasible, non-delay schedule durations. Each duration in that range may have one or more unique schedules yielding that duration. The result of the resource-constrained simulation reflects this. Figure 2 shows the two distributions as frequency histograms.
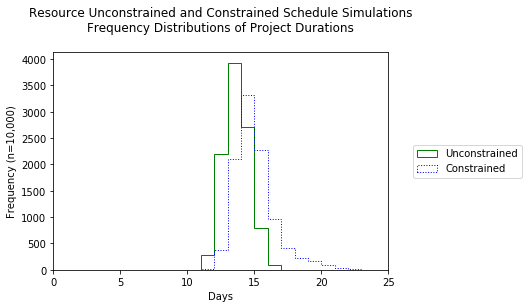
Figure 2. Frequency distributions of project duration from resource unconstrained and constrained simulations (n=10,000)
Figure 3 shows the mean and cumulative frequency distribution for project durations from the resource unconstrained and constrained simulations. The horizontal distance between the two means represents the expected delay caused by resource leveling. The difference between the unleveled schedule duration, 13 days, and the the expected unleveled schedule duration, 13.68 days, is influenced by merge bias (path convergence). Similarly, the weighted average duration of the unique, non-delay schedules is 14.28 days (see the prior article). The expected leveled project duration is 15.01 days. See Hulett (1995) for a discussion of Monte Carlo schedule simulation and the effect of merge bias.
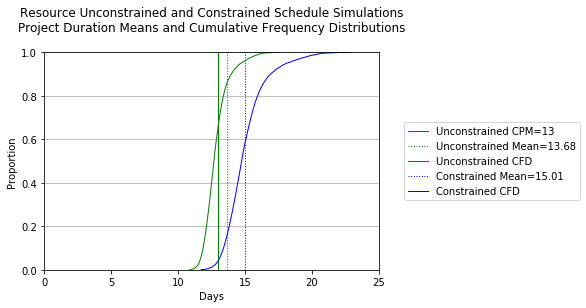
Figure 3. Mean and cumulative frequency distribution for project durations from resource unconstrained and constrained simulations (n=10,000)
Discussion
This article proposes the use of schedule simulation to predict the effects of resource leveling on project duration. The method goes beyond the simple Monte Carlo simulation of an unleveled or leveled schedule. As mentioned above, the result of the resource constrained simulation reflects a range of unique, resource-feasible schedules, not just one. However, only a simple example is presented here. The method needs to be explored further.
There is a point worth pondering. The usual optimization in resource-constrained scheduling is to minimize the project duration of the resource-leveled schedule. There are two 13-day, non-delay, resource-feasible schedules for the example presented here. However, from Figure 3, we see that the likelihood of achieving a 13-day resource-feasible schedule is less than ten percent. Pursuing a 13-day optimal schedule would be incongruous.
References
Deblaere, Filip and Erik Demeulemeester, Willy Herroelen, Stijn Van De Vonder. 2007. “Robust Resource Allocation Decisions in Resource-Constrained Projects.” Decision Sciences. 38 (1): 5-37.
Hulett, D. T. (1995). “Project schedule risk assessment.” Project Management Journal, 26(1), 21–31. Retrieved from https://www.pmi.org/learning/library/project-schedule-risk-assessment-2034.
Structured Data LLC. No date. “The beta-PERT distribution.” Retrieved from https://www.riskamp.com/beta-pert.
________________
© Nicklas, Inc. and robinnicklas.com, 2018. All rights reserved. Unauthorized use and/or duplication of this material without express and written permission from this site’s author and/or owner is strictly prohibited.
